
In this post I’ll be focusing on some best practices and tips to keep in mind when developing dashboards using Power BI. These tips have been gathered from personal experience and from other Power BI developers that have shared their experiences as well.
Copy and Paste your visualizations to easily recreate the formatting used – Once you’ve nailed down the font size, color scheme, and other formatting for a chart in your dashboard, copy and paste it to create the next one. Then simply change the visualization to the new chart that you’re trying to make. This will ensure that all your charts have the same formatting, and will save you time trying to change all those properties each time.

Copy and Paste visualizations to avoid re-doing the formatting.
Leverage images for getting a dashboard to look exactly how you need it to – Do you need to migrate a dashboard to Power BI and have it look exactly the same? Do you need a “pixel-perfect” layout? If so, it may be easier to create these shapes or layouts outside of Power BI, and then import them as images that can be used in the background. Place your KPIs or Charts on top, and you will quickly create dashboards that look exactly the way you need them. I find Excel to be a great tool for mocking up dashboards and creating these images. You can also make these into templates for your Power Users to leverage as the starting canvas for their dashboards, making it easier for them to get started, and creating a consistent look and feel across Power BI dashboards in your company.

Dashboard Template using Excel.
Use the Title of Text Boxes to control the font color – This is more of a workaround due to a lack of functionality that I think should have been there since the beginning. Currently, text boxes do not have a property for changing the font color. To get around this, add a blank text box and enter your text in the Title property of the text box. Within the Title property, you can control the size, color, and background of your text (with the tradeoff that now you can’t change the font type 🙂 ). Alternatively, you can create a text image and insert it in your dashboard using the tip above. Hopefully this is a short-term trick, and the functionality will be added in an upcoming release. Cast your vote here!
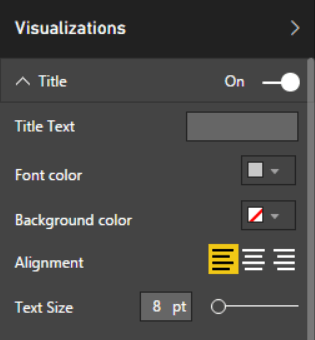
The Title property lets you control the Font color.
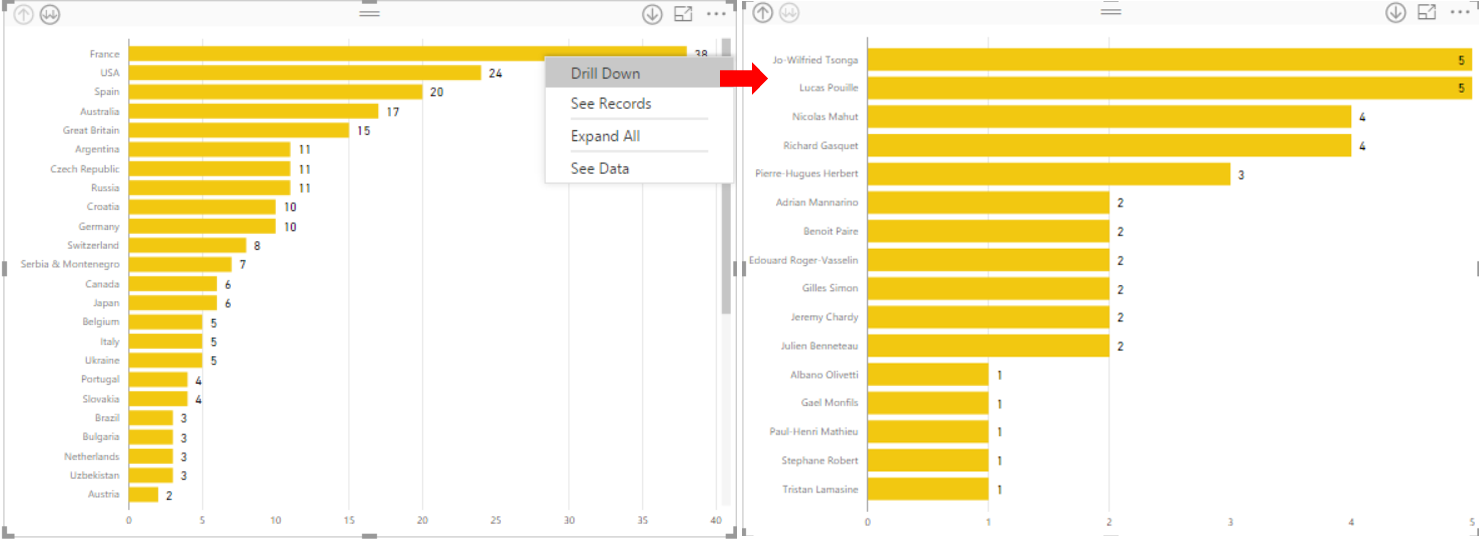
Use the Stacked bar chart as a Slicer – Instead of having a slicer with a long list of values, you can use a Stacked Bar Chart that quickly shows the values that are most important to users. Additionally, you can leverage drill downs in the chart to minimize the amount of scrolling, and make it easier for users to filter the data in the dashboard. For example, in the image below, instead of showing a list of all the players, I start out by listing their nationalities and letting the user drill down a specific country for a subset of the players that they can then filter on.

A Stacked Bar Chart can serve the same purpose as a Slicer, and is more visually appealing.
Use the Page Size properties to make your content fit – While the default page size is 16:9, you can manually configure the Width and Height of the page so you can increase/decrease the size of the page to perfectly fit the visualizations you need. Keep in mind that the full rendering will only show when viewing the dashboard through the Power BI site, or in full screen mode (embedding a Power BI dashboard on a webpage won’t scale to your customized size).

Change the Type to Custom to control the Width and Height.
Limit visualizations to a maximum of 5 charts/reports per page – Don’t overwhelm your users with data and visualizations. Keep it simple and to the point. Leverage drill downs and additional pages to let users find more information or additional content.
Provide user-friendly names to your fields – This should be a no-brainer. Avoid using database naming conventions and obscure labels for your fields. Design the dashboards with the mindset that someone new to your company or department may be looking at it, and make the labels of fields as intuitive as possible. It’s also a good practice to provide a data dictionary in case users have questions about what each field represents, or where it is being sourced from.
Hopefully some of these tips will make your life easier when designing your next Power BI dashboard. What other tips or best practices have you come across? (Leave your comments below!)


Thank you!