
This weekend I spent some time researching how to leverage Azure’s Stream Analytics engine and testing out the connection to Power BI in order to create a dashboard with a near real-time data feed. There are many different business scenarios where real-time data provides valuable insight and can help a company adjust to changes more quickly. For example, in oil and gas drilling, many drill bits come equipped with an array of telemetry sensors that provide key information such as shock and vibration, weight and torque on the bit, pressure, and temperature. Measuring this information in real-time can alert engineers of when the drill bit is at risk of being damaged, and allows them to take remedial actions for more efficient drilling.
Another example can be found in marketing and retail companies. For instance, a retail company may be interested in what consumers are saying about their product during a new launch, or whether the attendees at an industry event are expressing positive or negative sentiments on social media. In these cases, using a real-time feed against a social media sites such as Twitter and Facebook can provide actionable insights.
Using Azure to Analyze Data in Real-Time

In Azure there are 2 main components that work together to provide real-time time analytics: Event Hubs, and Stream Analytics. An Event Hub functions much like a data pipeline. It can ingest a large amount of events per second and stream them into multiple applications. The event hubs allow you to bring the data into Azure, while Stream Analytics lets you query that data for aggregation or alerting, and send the results to an end point such as a SQL Table, Azure Blob storage, or in the example below, Power BI.
In this example I am using an event hub to ingest data from Twitter, aggregate the data using a Stream Analytics job, and outputting the results into a Power BI dashboard.
Use an event hub to read data from Twitter
The first step is to create an event hub in your Azure environment. I won’t go into the details of how to do this, but you can find out more information here: Getting Started with Event Hubs. Once you have an event hub created, you will need an event generator application that can send events to the event hub. I used a .NET application that can be easily configured to call the Twitter API to get tweets events, and then send the results to an event hub. You can download the Visual Studio solution here: TwitterClient
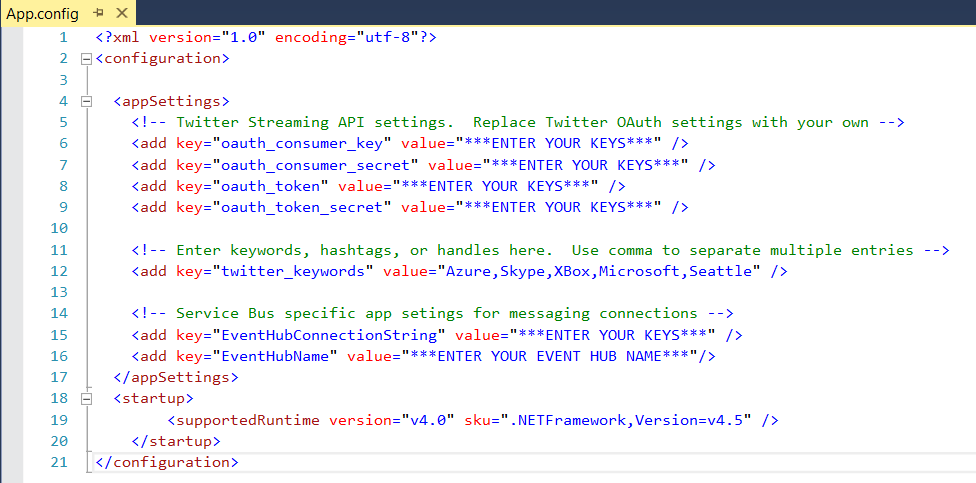
The App.config file contains the section that you will need to update to match your environment. You will need the event hub connection string and name to send the results to the event hub, and you will need the Twitter API keys to establish a connection to Twitter. To get the Twitter API keys, you will need a Twitter App.
Creating a Twitter App is pretty simple. Just go to https://apps.twitter.com/ and create a new app. Note: You will need to have your phone number as part of your account profile in order to create an app. Once your app is created, navigate to the Keys and Access Tokens tab to find your keys and add them to the App.config file.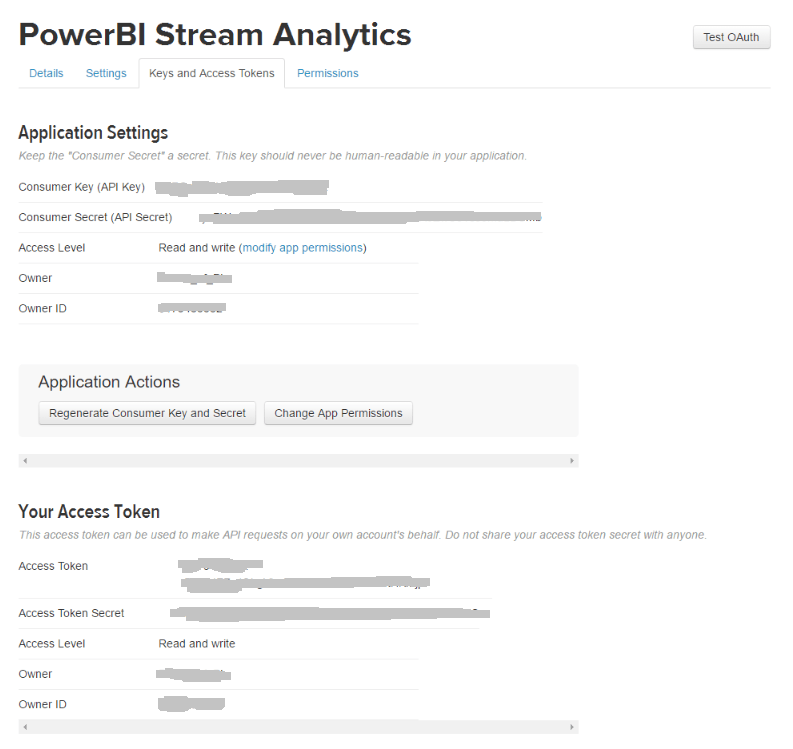
Provision a Stream Analytics job
- From the Azure portal (portal.azure.com), click New > Data + Analytics > Stream Analytics Job.
- Specify the following values, and then click Create
- Job Name: Enter a job name.
- Subscription: Choose a subscription.
- Resource Group: Choose and existing group or create a new one.
- Location: Select the region where you want to run the job. For better performance, consider placing the job and the event hub in the same region.
Specify a job input
- In your Stream Analytics job click Inputs, and then click (+ Add) to create a new Input.
- The dialog box that opens will walk you through a number of steps to set up your input.
Input Alias: Enter a friendly name for the job. Note: This name will be used later when building the query.
Source Type: Event Hub.
Subscription: Choose a subscription.
Service bus namesapce: Choose the service bus that contains your event hub.
Event hub name: Choose an event hub.
Event hub policy name: Choose the policy that you created for the event hub. This policy should have Manage rights.
Event hub consumer group: Type the consumer group if you created one.
Event Serialization Format: JSON
Encoding: UTF8 - Click the Create button to add this source and to verify that Stream Analytics can successfully connect to the event hub.
Specify a job query
- Click Query from the Stream Analytics job page.
- Add a query. In my example I used the following:
SELECT Topic,count(*) AS Count, Avg(SentimentScore) AS AvgSentiment, System.Timestamp AS Insert_Time
FROM CallStream TIMESTAMP BY CreatedAt
GROUP BY TumblingWindow(second,5), Topic
This query uses the Timestamp By keyword to specify a timestamp field in the payload to be used in the temporal computation. If this field wasn’t specified, the windowing operation would be performed using the time each event arrived at Event Hub. See “Arrival Time Vs Application Time” in the Stream Analytics Query Language Reference.
Also note that I am using group by TumblingWindow. This allows you to group the count of incoming tweets into time windows (in my case 5 seconds), along with the Topic associated with the tweet.
The name of the table CallStream is the name of the Input Alias provided in Step 2 above.
- Click Save.
Specify a job output
- Click Output from the Steam Analytics job page.
- Click (+ Add) to create a new Output.
- The dialog box that opens will walk you through a number of steps to set up your output.
- Enter a name for the Output alias.
- For Sink, select Power BI from the drop down menu.
- When you choose Power BI as the Sink (output), you will see an Authorize Connection screen similar to the one below:

- Click Authorize and supply a work or school account that is already associated with Power BI. If you don’t have one created, you will need to create one.
- Select a Group Workspace
- Enter a Dataset Name. This is the name that you will see under the Datasets list in Power BI.
- Enter a Table Name. This will be the table that contains the records inside your dataset.
- Click Save.

Once you have configured the Stream Analytics job, go to the Overview page and click Start.
***At this time make sure that your application is running and generating feeds into the event hub.
Create a dashboard in Power BI
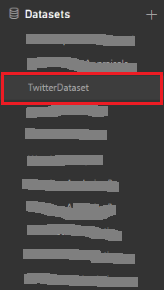
- Go to Powerbi.com and login with your work or school account. If the Stream Analytics job query outputs results, you will see that your dataset is already created:

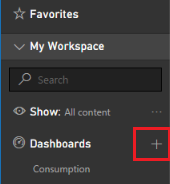
- To create the dashboard, go to the Dashboards option and create a new Dashboard.

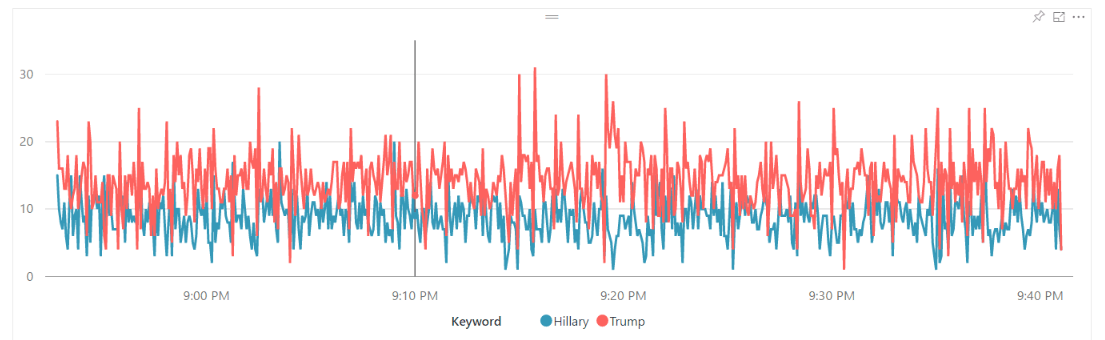
- Click on the dataset created by your Stream Analytics job. This will take you to the report page where you can create visualizations using this dataset. In my example, I used a tweet analysis for the keywords “Hillary” and “Trump.” I created 3 charts, 1 that showed the counts of sentiment by Topic (Hillary, Trump) over time, and 2 that showed count of tweets by sentiment type for each topic:


- Once you are finished with the chart(s), save the report, and use the Pin option to pin each chart to the dashboard that was just created:

- Navigate to the dashboard. You should see the numbers being updated in real time. In my example, I used a 5 second grouping window, so the numbers get updated every 5 seconds. You can check out the short clip below to see it in action:
In the clip you can see the .NET application outputting messages from the Twitter API into the Event Hub, which are then processed by the Stream Analytics job and consumed via a Power BI dashboard.
The Power BI Report does not get updated in real time. This functionality is only applicable when viewing pinned report items on a dashboard.
This example could be pretty interesting to run live during the presidential debates to see how the social media reacts in real time :). Stay tuned!


Great blog post! I seem to get an error when running the app Microsoft.ServiceBus.Messaging.MessagingEntityNotFoundException’ in Microsoft.ServiceBus.dll
Hi DS – can you try re-building the solution and seeing if that fixes the error?
Looks like I’ve got pass that but getting a ” token has an invalid signature” error now.
Did you update the Twitter API keys with the ones from your Twitter app? Can you provide the exact error description that you are getting?
Hello, I am using Azure stream analytics to get telemetry data from IoT hub to Power BI. Telemetry data is being second continuously. But when I see the line graph in power BI, it does not seem to be smooth line graph. I see that there is slight distortion when the line graph appears in power BI. But when I send data from PubNub, it loads smoothly. I am using a simple select * into powerBI from streamanalytics.
Did you observe the same?